New Tool: DetentionReports.com Provides Valuable Updated Data about ICE Facilities
Relevant Research launches Deportation Reports, a new tool providing real-time data on ICE detention centers using our Interval ADP method for more accurate population estimates.
Relevant Research is launching a new tool today to provide up-to-date information about ICE’s immigrant detention centers across the United States. Deportation Reports finally makes individual detention-center-level data—including Interval ADP—available to the public in an easy-to-reference format.
As you know from my frequent Substack posts, immigration detention numbers have exploded in the past five months and now approach 60,000. Due to Congress’s massive allocation of funding to ICE, these numbers will continue to grow in the coming months and years.
The most current data we have on detention comes from ICE’s semi-monthly reports that detail exact numbers of people detained, disaggregated information as to their criminal status, and facility-by-facility average populations. Each semi-monthly update comes with a large number of data tables that can be difficult to validate, understand, and properly contextualize—especially for people who do not work with the data on a regular basis. For example, the detention facilities population data, in particular, are oddly converted to fiscal year averages when a clear total would do.
In May, we introduced Interval ADP, a method to calculate population estimates based on comparing the two most recent population averages at each facility. This method is now being used by news outlets and non-profit organizations to determine average daily populations at ICE’s immigrant detention facilities.
In our new Detention Reports tool, we make Interval ADP publicly available for all active facilities and extend it to other categories in ICE’s data, including Gender, Criminal Status, and Security Classification. These numbers provide even more granularity into the composition of immigrants held at individual facilities.
We believe that reporters, researchers, policymakers, and members of the public will find DetentionReports.com timely, original, and valuable as immigrant detention continues its dramatic growth.
Detention Reports is the result of the hard work of Sunita Kunwar, a graduate student in data science at La Trobe University in Melbourne, Australia, who worked closely with Adam Sawyer at Relevant Research to develop the process for systematizing these reports and providing a clear way to validate, update, and publish these findings on an ongoing basis.
We would greatly appreciate any efforts you can make to share this resource online and through listservs so that as many people have access to the data as possible. We also welcome your feedback, and we will incorporate comments into our Detention Reports development roadmap.
Let’s Walk Through the Detention Facility Reports
If you are on a desktop, you will likely first notice a table of contents to the left-hand side of the page. This table links to the major sections of the report and will continue to be available to you as you scroll down the page. Future iterations of our report will make this available for mobile devices, as well. Other than this difference, the website is designed to work smoothly across platforms, devices, and screensize.
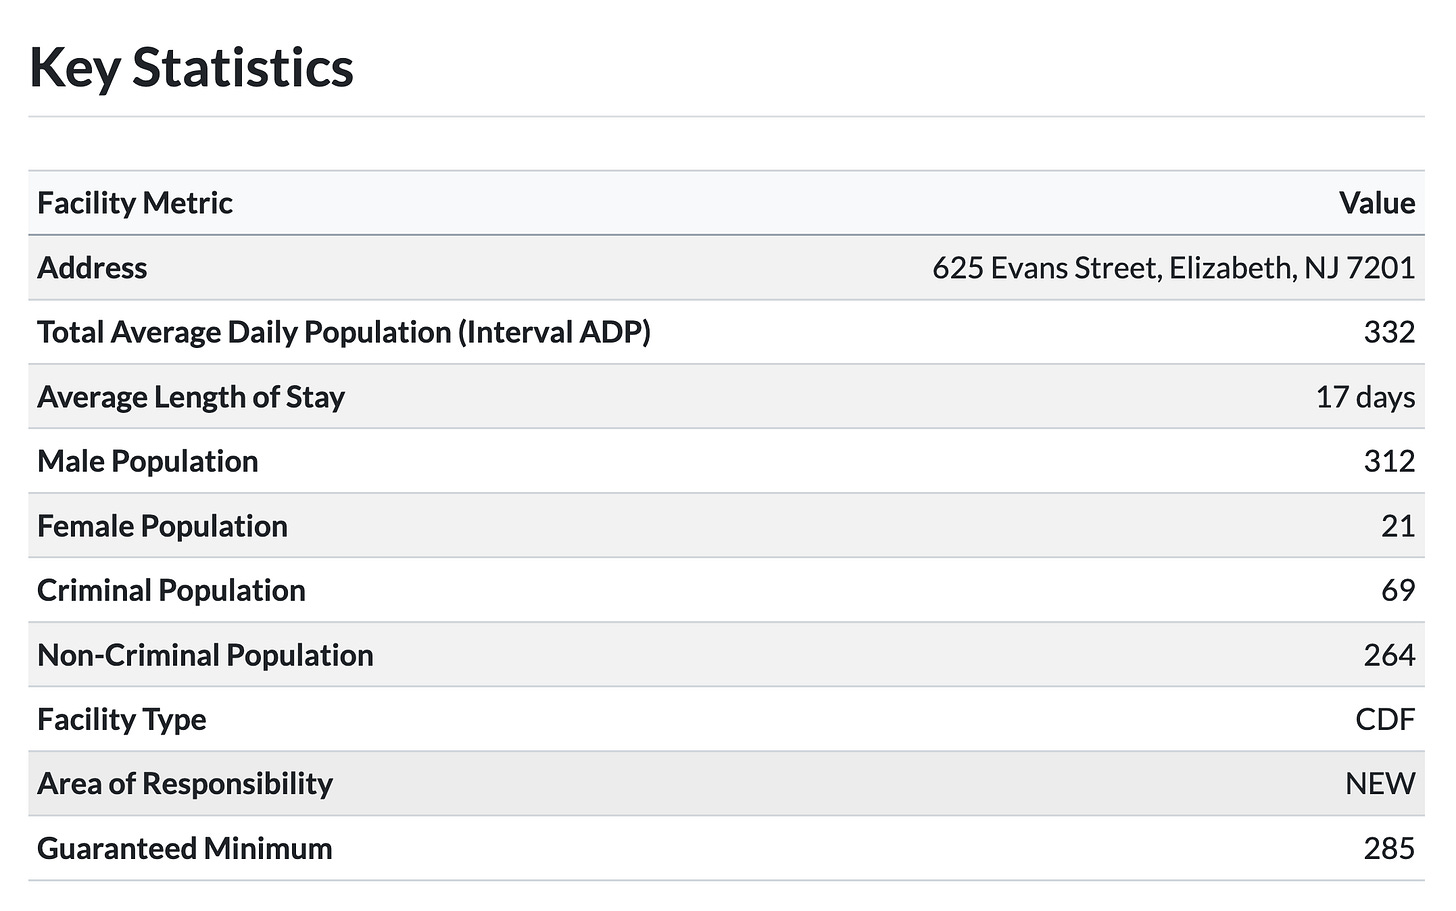
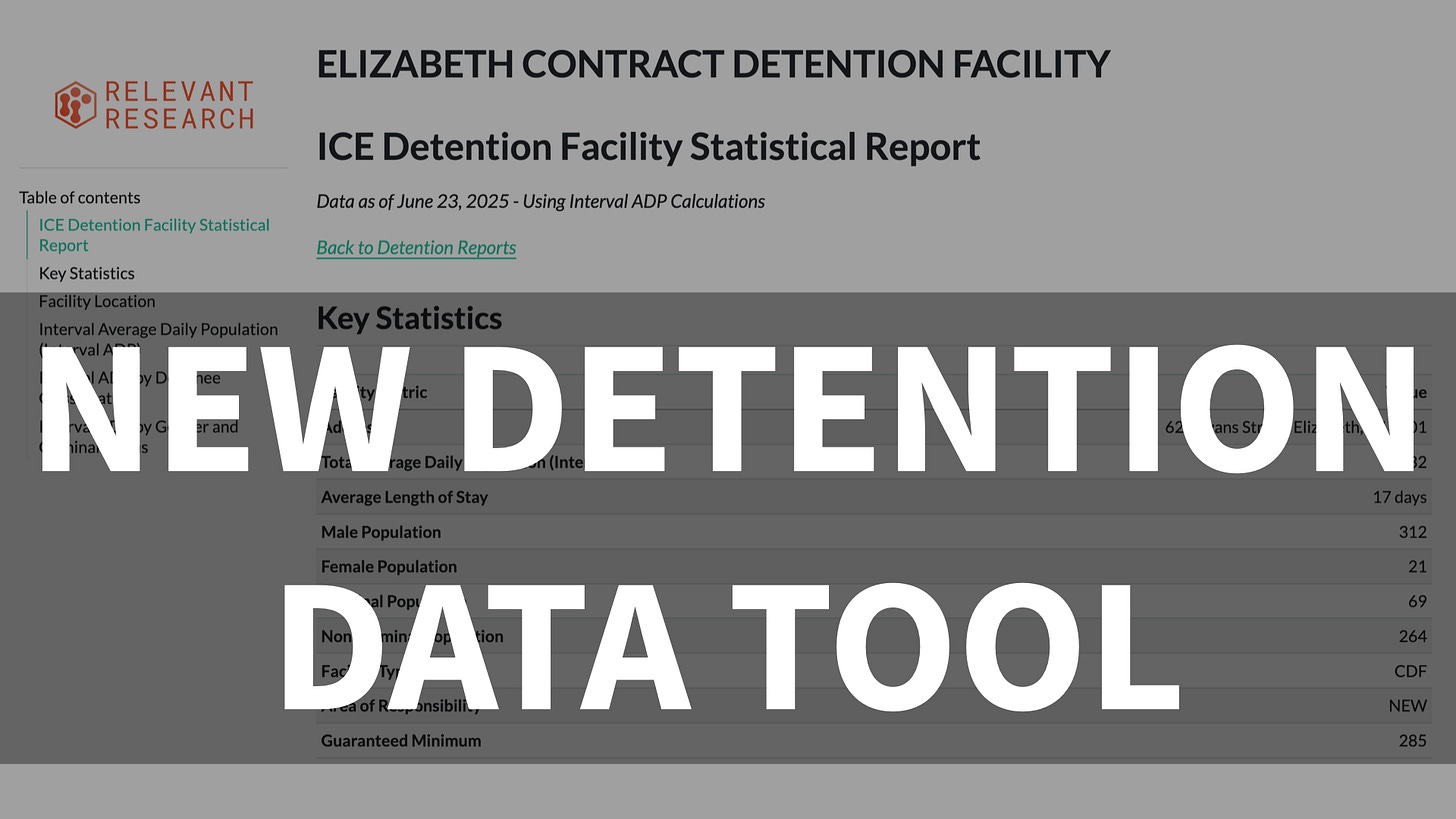
Underneath the title of the facility and the date of validity for each report, we have a table that has the key statistics for each facility. Every statistic here that relates to population utilizes the Interval ADP measure, not ICE’s fiscal year to date average. For this reason, these numbers will differ from ICE’s figures, in some cases significantly. We believe these statistics are, in most cases, closer to reality.
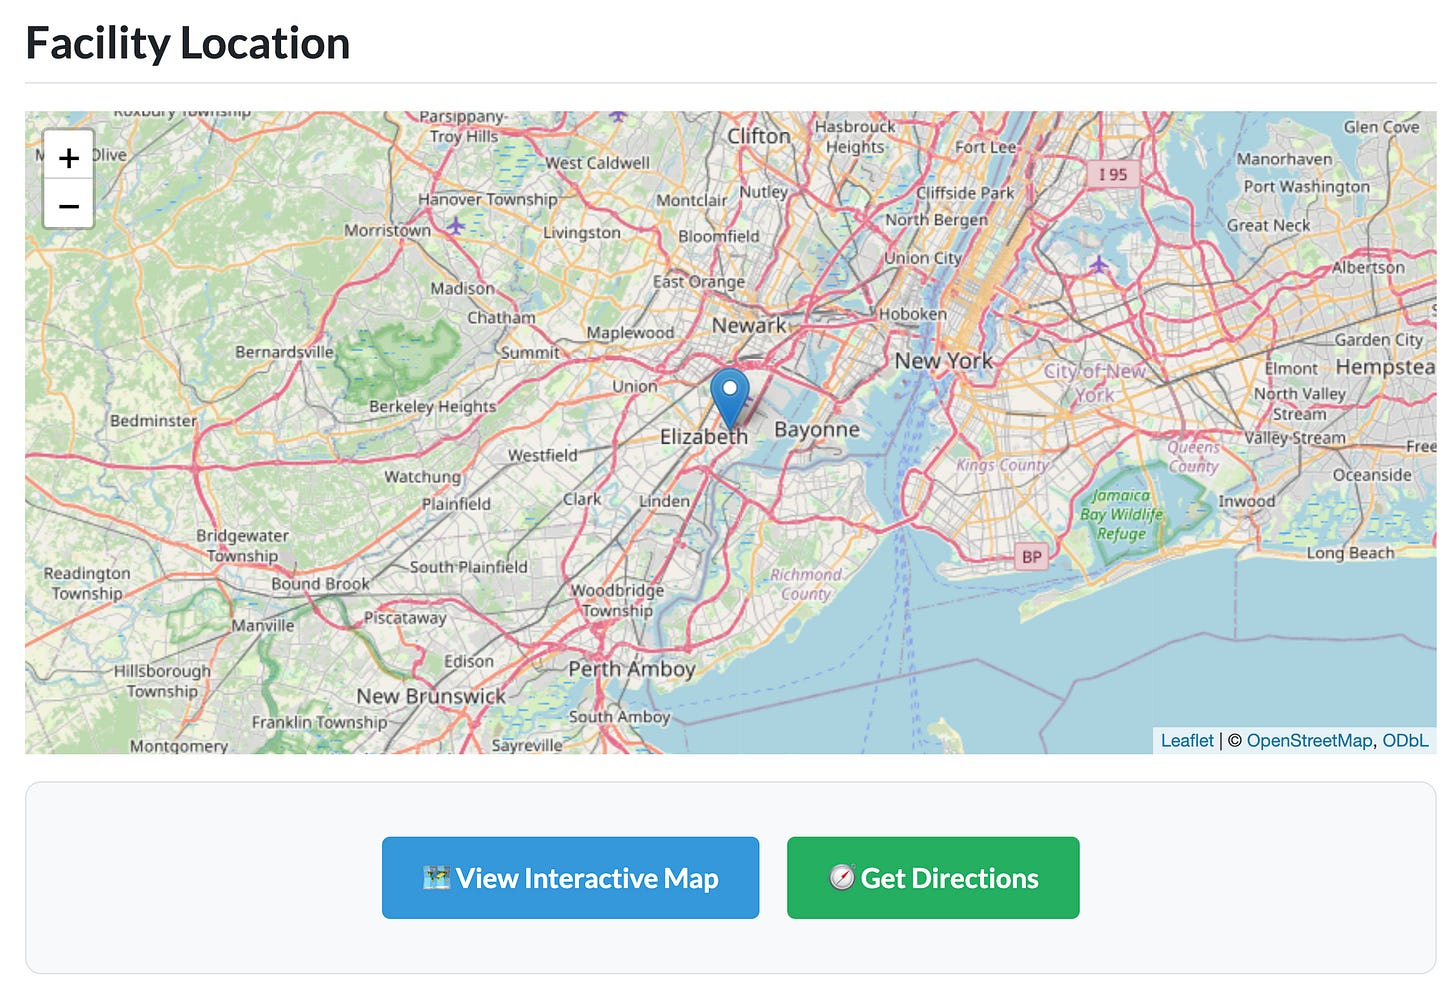
Underneath the facility page is a map showing the location of the facility. The map is interactive, meaning you can zoom in and out to get a sense of the geographic context of the facility. Two buttons below the map allow you to open this in a Google Map environment or to get directions to the facility.
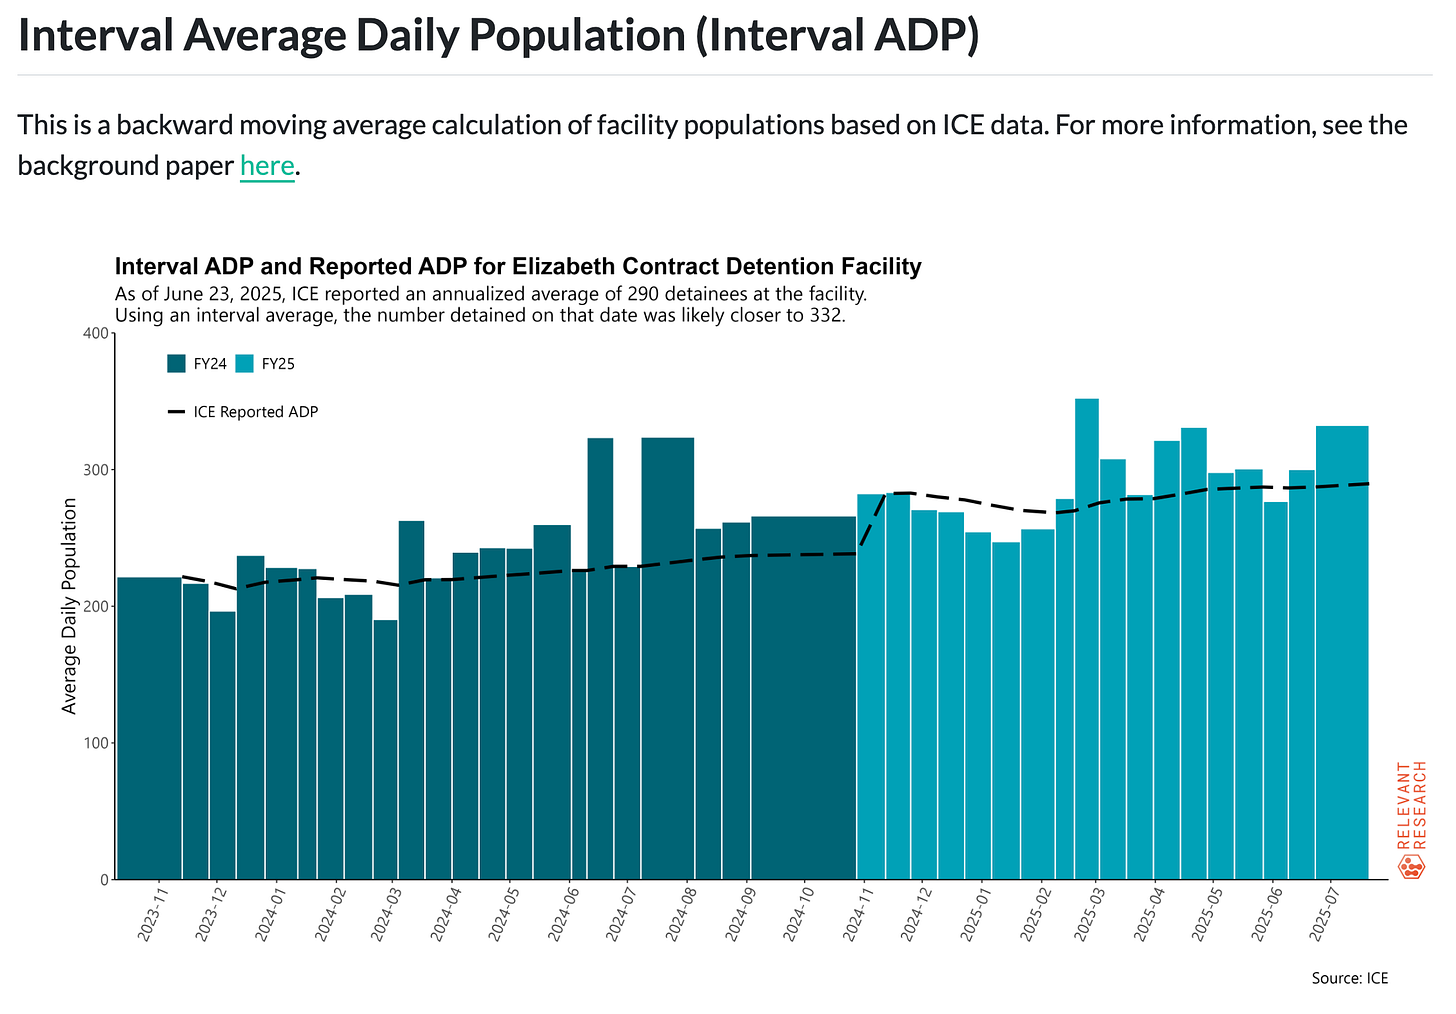
Many find it useful to see how a facility’s population has changed over time. That’s what the Interval ADP bar chart shows in the next section. These have been published before in certain updates in posts in April and June. The DetentionReports.com page now provides a venue for these to be updated shortly after every new release.
Note that the plot starts in October 2023, long before many detention centers began hosting ICE detainees again. We have decided to keep the x-axis the same on all plots to illustrate when detention centers came on or offline in ICE’s system.
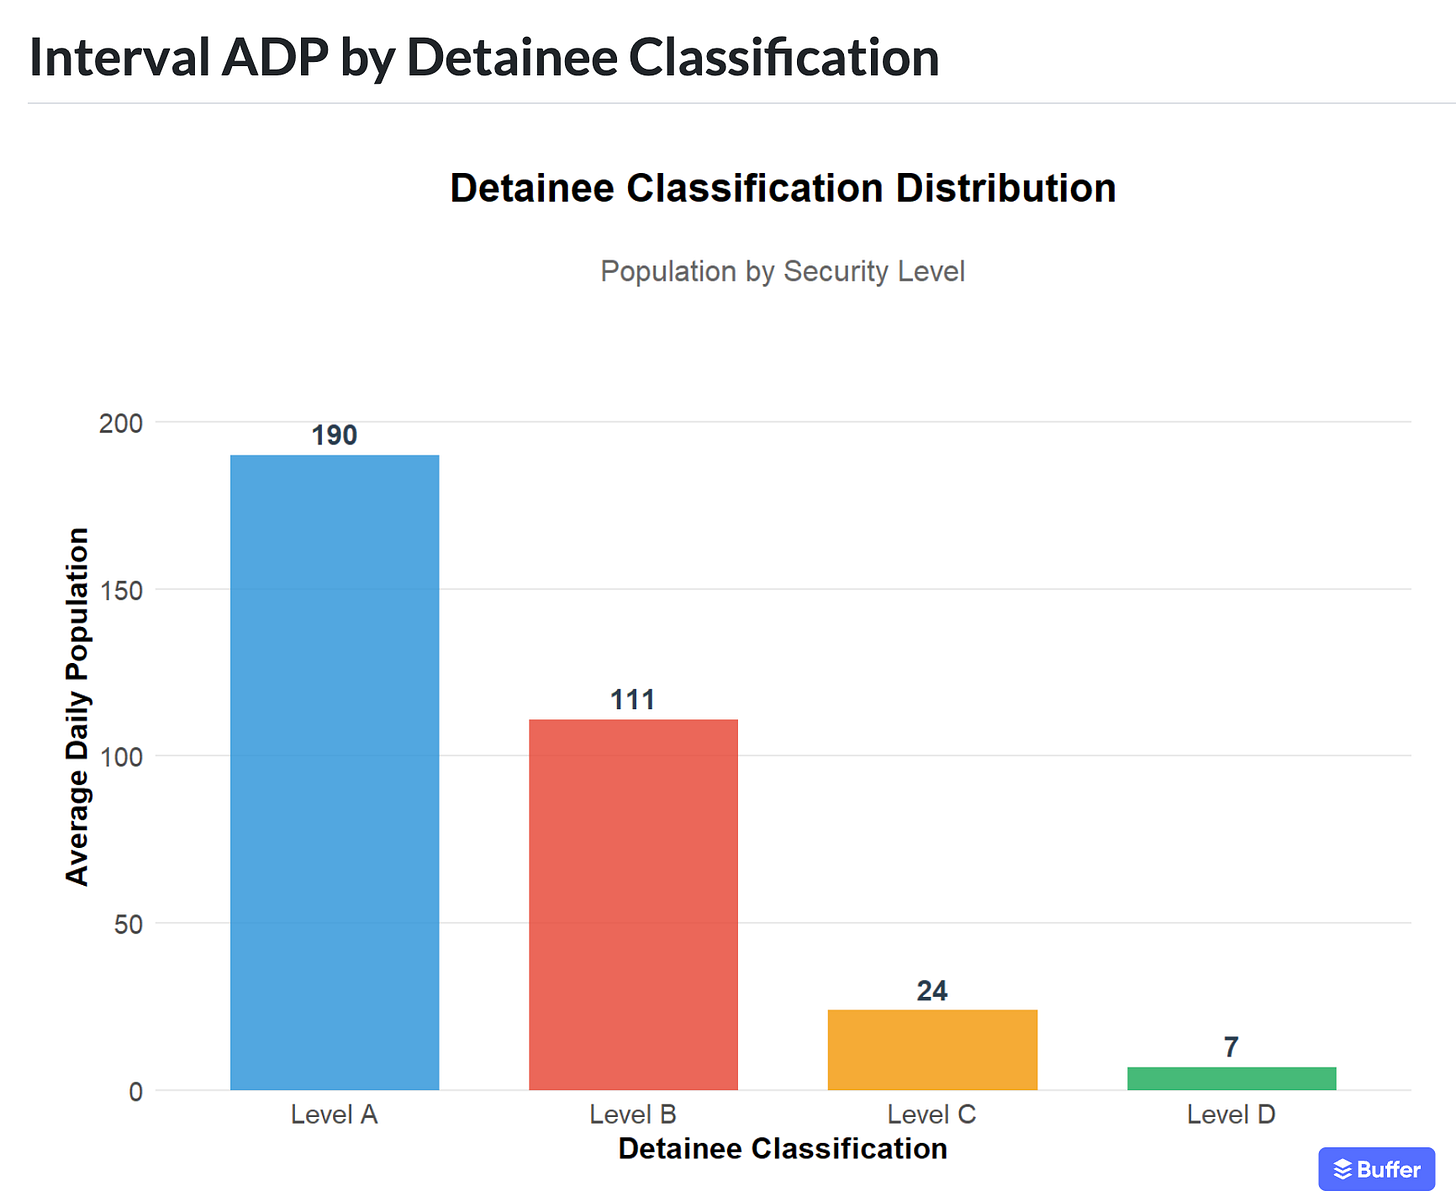
ICE classifies detainees in four categories based on perceived security risk. The next bar chart shows how many are assigned in each category according to ICE for each facility. As is the case in other parts of the report page, this is converted into an Interval ADP. These may not align with the numbers ICE reports, particularly in the latter half of the fiscal year (April-September). The interval ADP method provides a more updated average population figure based on more recent information.
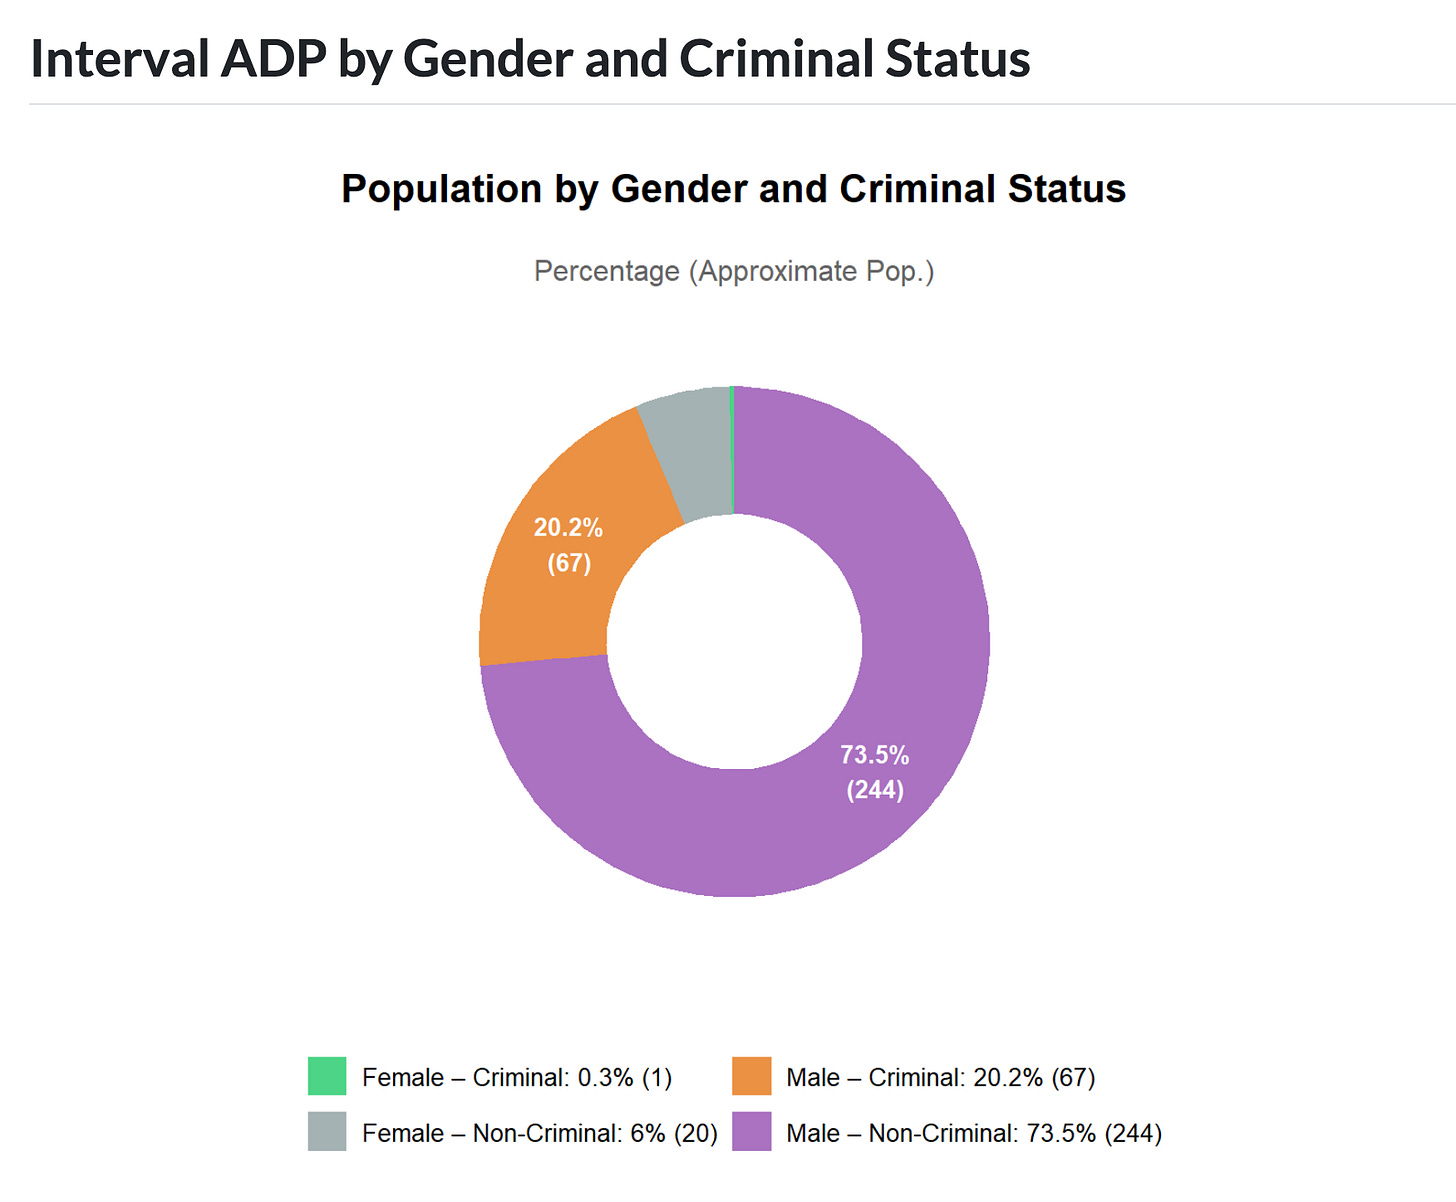
The final chart shows the Interval ADP by Gender and Criminal Status. Again, these are converted into an Interval ADP, which means they are appropriate for citing as the nearly-current reality at each facility.
Note that summing the different categories in the Detainee Classification or Gender/Criminal Status charts may not exactly equal the Interval ADP of the entire facility. This is due to rounding.
Validation note: ICE facility data released on July 17, 2025 had too many irregularities to make it suitable for processing. Given the unreliability of the numbers, we have not updated the figures to the most recent release. To learn more, we encourage you to read our previous post detailing the impossibility of what ICE reported in mid-July. This is just one more example of why we do the hard work of validation—and why you can trust that, to the best of our ability, we will only publish data we trust.
As updates move forward, the “Data Current As of Date” may differ depending on the facility. In most cases, this is because ICE stops reporting a facility if it has a Reported ADP less than 1 for the fiscal year. If the facility appears on the sheet again in the future, it will be appropriately updated on Detention Reports.
In the current era of immigration statistics transparency, ICE detention statistics have the benefit of being one of the most up-to-date and detailed. Unfortunately, much of the information embedded in the data releases requires sifting and calculations. The parameterized reporting method described here is an effort to provide the essential information for every ICE detention facility in an updated and understandable format.
Finally, if you see something that seems mistaken, or if you have questions about the reports, please reach out to Adam at adam@relevant-research.com.
Support Public Scholarship
This newsletter is only possible because of your support. If you believe in keeping this work free and open to the public, consider becoming a paid subscriber. You can read more about the mission and focus of this newsletter and learn why, after three years, I finally decided to offer a paid option. If you already support this newsletter financially, thank you.





Thank you for sharing your hard work!
Is there a way to search by State?
Way too many.....💙
Really great work, Austin!