Understanding ICE’s Detention Numbers
ICE releases detention statistics on a bi-weekly basis. For the past year, we at TRAC have been systematically collecting that data to provide further insight into the immigration system.
One immigration detention statistic that can be confusing is the number of people in detention versus the number of new people put into detention called “book-ins.” Using a running total of the average daily detention population per month and the total number of monthly book-ins, we can see how these two numbers give slightly different but interrelated perspectives on detention.
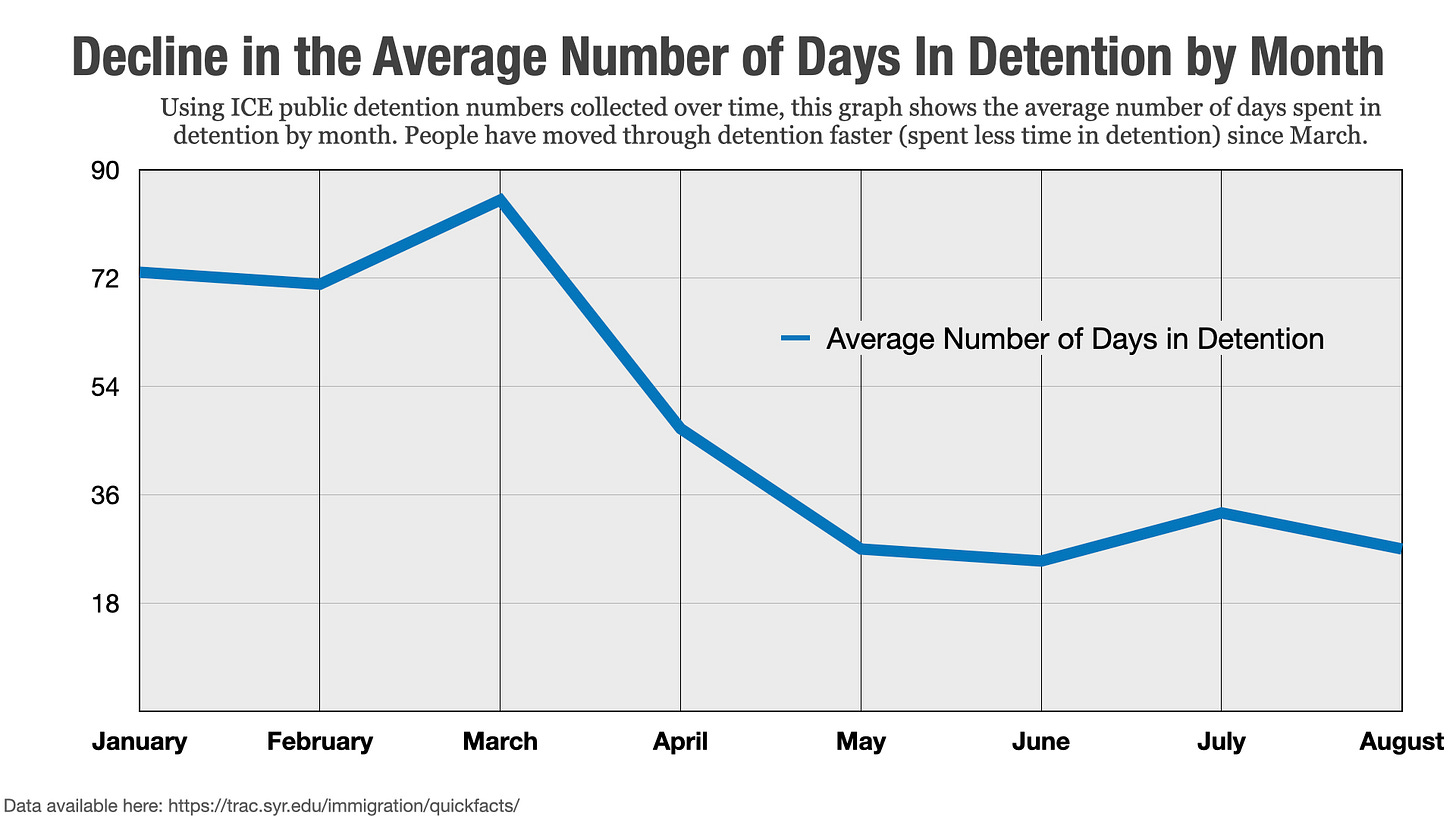
To reinforce the point, consider the average length of stay in detention measured in days for each month of the Biden administration. Shorter stays mean that people are moving faster through detention. But notice that the decline in length of stay is not necessarily accompanied by a decline in total numbers of people in detention. In fact *more* people are entering detention (shown by book-ins). If length of stay had remained at March levels (nearly 90 days), the growth of book-ins probably would have produced a much more significant growth in the total number of people in detention because they wouldn’t have been released so quickly. Just a reminder to always put data in context.


