
Detention Reports Updated: New Data, Improved Search, and Growing Media Adoption
Detention Reports now updated with latest ICE data covering 184 facilities. New features include state filtering and data quality notes based on user feedback.


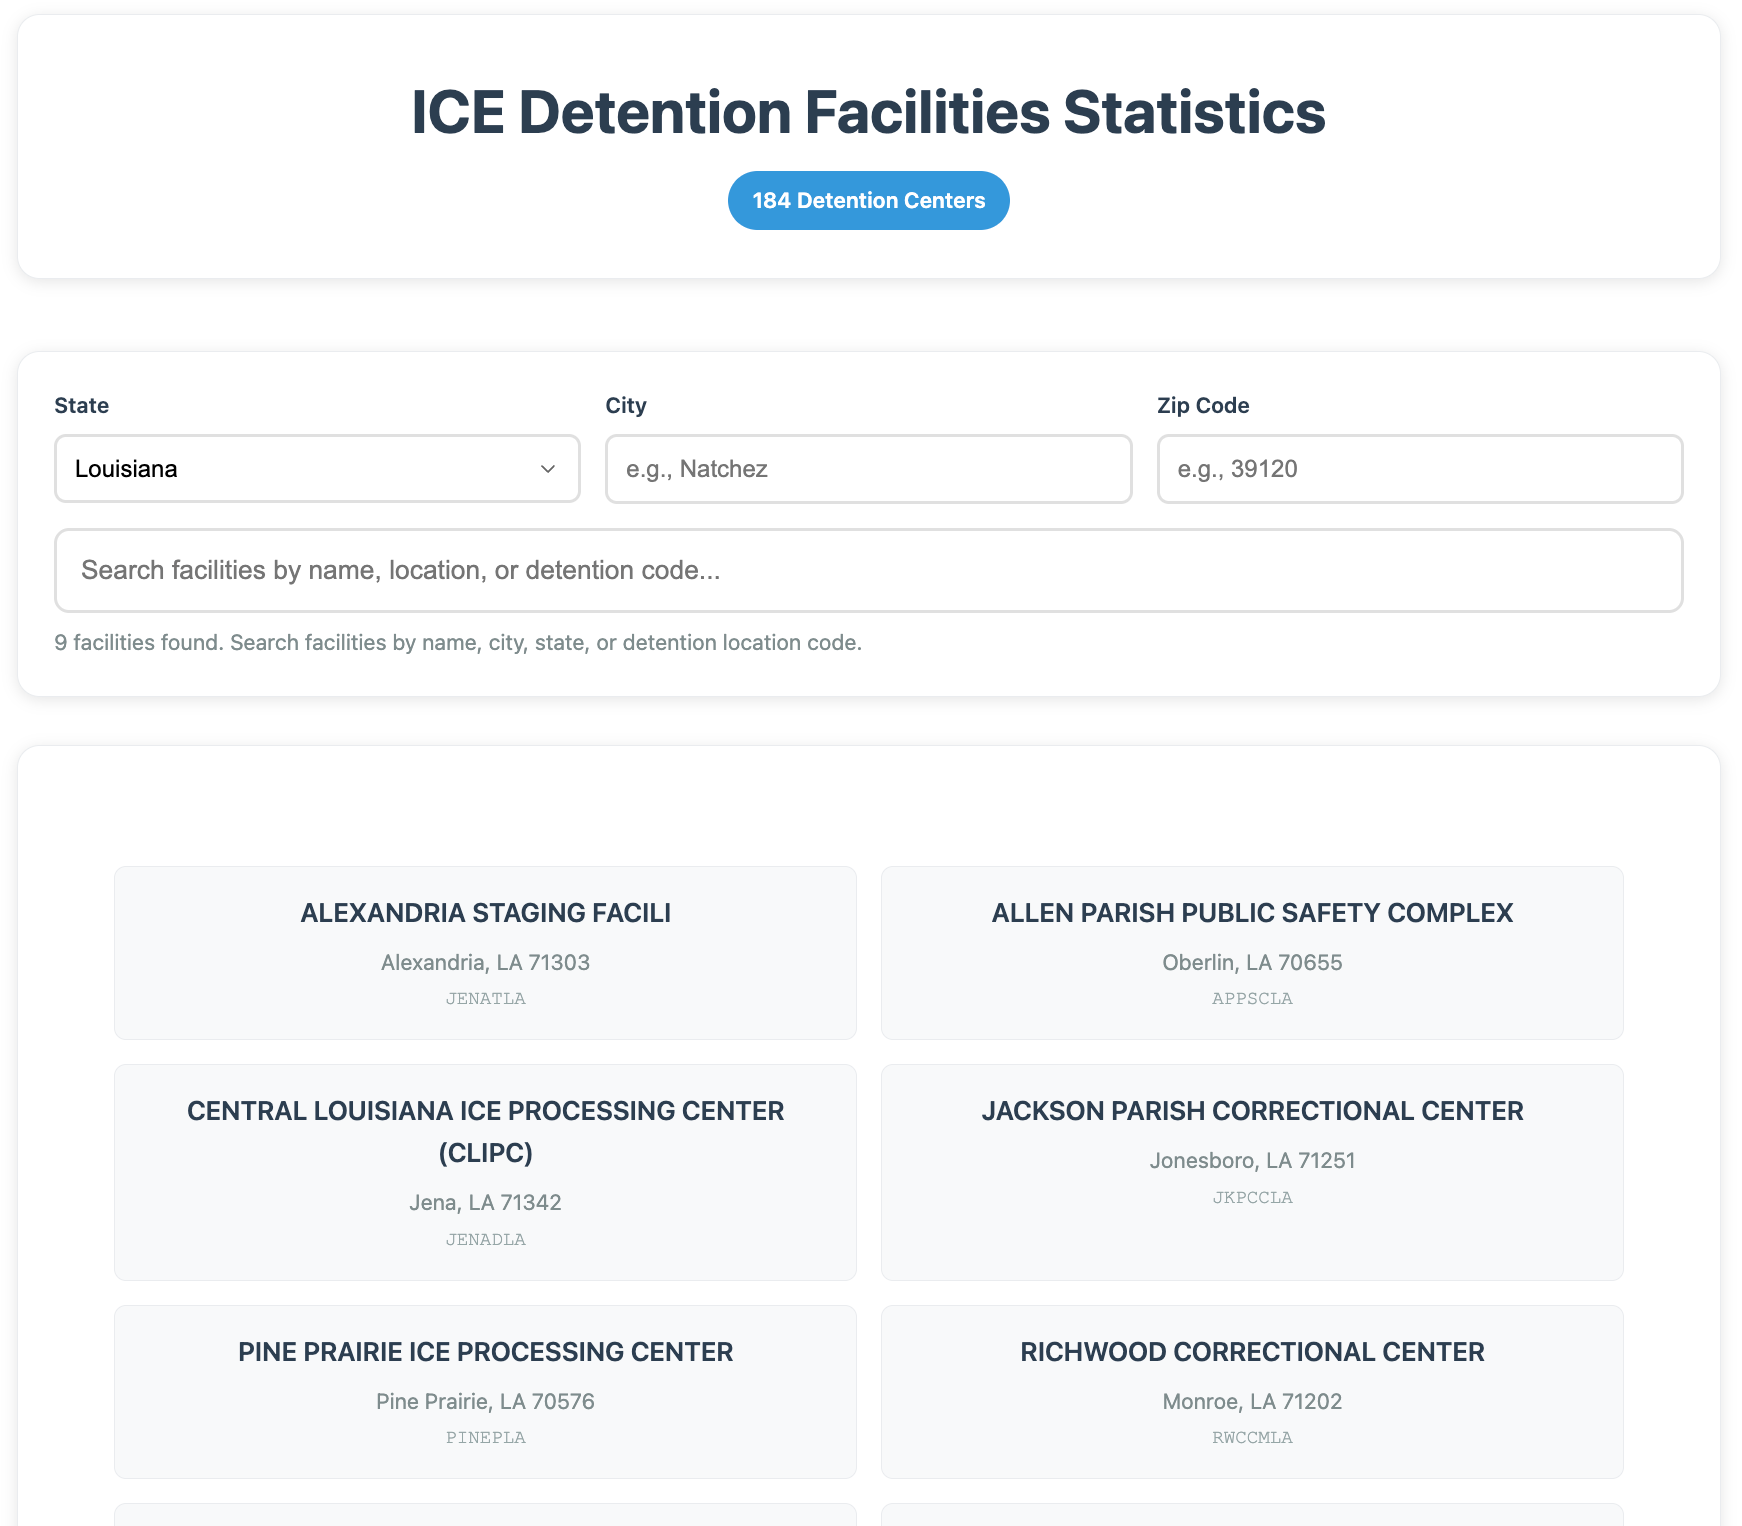
Immigration and Customs Enforcement (ICE) released updated detention statistics on Thursday, and we've already updated Detention Reports accordingly. The website now includes 184 facility reports based on ICE data from June 23, 2025, and July 21, 2025.
Thanks to the valuable feedback of many users, we have already made improvements in the search options for the reports, included a link to our methods paper, and we are beginning to document known issues with ICE’s data as they arise.
In our explanation of this new tool earlier this week, we said, “we believe that reporters, researchers, policymakers, and members of the public will find DetentionReports.com timely, original, and valuable as immigrant detention continues its dramatic growth.”
On that note, we are thrilled to see reporters using this tool already. We want to express our gratitude to José Olivares at The Guardian for incorporating DetentionReports.com into his excellent article FBI investigates drug-trafficking ‘epidemic’ in prison also housing Ice detainees: ‘A lot of corruption’, as well as Alanna Vagianos at HuffPost for using the data in her article What Happens To The Women ICE Detains?
Since our initial launch of DetentionReports.com, we've received tremendous feedback from users, and we've already begun incorporating key improvements to make this critical data more accessible to reporters, researchers, advocates, and the public.
Many people suggested adding a feature on the main page that allows users to filter for a specific state—an entirely reasonable suggestion given the growing number of ICE detention facilities across the United States and territories. In response, we added a dropdown menu for US states and added search boxes for city and zip code. We maintained the global search bar function, as well.
Other people reached out with notes about some of the graphs with nonsensical outputs. ICE has released anomalous, empty, and inconsistent data recently, and these issues affect calculations like Interval Average Daily Population (Interval ADP).
It brings up a classic balance that anyone who collects data from administrative sources must weigh: when to share the numbers reported by ICE (regardless of quality) and responsibly validating and potentially withholding numbers that could lead to confusion and misunderstanding.
With this in mind, we have created a notes document that can be considered an errata page of sorts. It includes decisions that we have made to exclude certain facilities and certain data updates based on the results of our analysis and validation processes. This is a living document that will grow over time. Here is a copy of what you find at the link above for your convenience:
# Notes

*June 23, 2025*: Four facilities listed by ICE on this date featured population averages that were impossibly high:

-   Fayette County Detention Center
-   La Paz County Adult Detention Facility
-   Lexington County Jail
-   New Hanover County Jail

Population numbers reported by ICE for these four facilities have been excluded from the dataset for this date.

*July 7, 2025*: More than half (96 out of 172) of the facilities listed by ICE on this date featured population averages that were impossibly low. While it's quite possible that ICE released correct populations for other facilities, the pervasiveness of the error has forced us to drop this entire dataset from release.

*July 21, 2025*: One facility listed by ICE on this date featured population averages that were impossibly low:

-   Northwest Regional Corrections Center

Population numbers reported by ICE for this facility have been excluded from the dataset for this date
A few people asked for documentation related to the method of calculating Interval ADP. We added a direct link to our paper on the topic at the bottom of each report.
In addition to these improvements, we also received many other recommendations that we have not yet addressed in this update. Some suggestions included ideas we already had planned, like adding a map of detention centers. Other creative suggestions we hadn’t thought of were added to our work queue, and we hope to get to those soon.
Thank you all for your interest in this project—please keep the feedback coming! To submit questions and suggestions, or for press contact, please email Adam at adam@relevant-research.com. Or leave a comment below.
Support Public Scholarship
This newsletter is only possible because of your support. If you believe in keeping this work free and open to the public, consider becoming a paid subscriber. You can read more about the mission and focus of this newsletter and learn why, after three years, I finally decided to offer a paid option. If you already support this newsletter financially, thank you.


 | A guest post by
|
How are the 48 hour expedited removals posted by ICE? Or are they even posted? It’s becoming clearer that ICE was putting pressure on farmworkers arrested in the Glass House raids in Carpinteria and Camarillo, California to sign the removal document for expedited removal to Mexico. From articles, and GoFundMe posts 12 so far but I think the number is much higher especially in lieu of the physical beatings and threats of long jail reported from the farmworkers families.
This is so timely, I've been working on an equivalent to detentionreports.com in my spare time. It's a painful task validating ICE spreadsheets.
As you calculate per detention center interval ADP, is there any room to also use statistical techniques to detect things like outliers and the beginnings of trends?
Also have you considered expanding detentionreports.com to include aggregated ICE data. I'm thinking of statistics like Average Length of Stay, Fear decision service turn around time, or segregation counts?