

ICE's Immigration Enforcement Data: Can You Trust It?
ICE is publishing data about the Trump administration's immigration enforcement surge, but creating confusion in the process. An essay about data skepticism and a call for greater transparency.

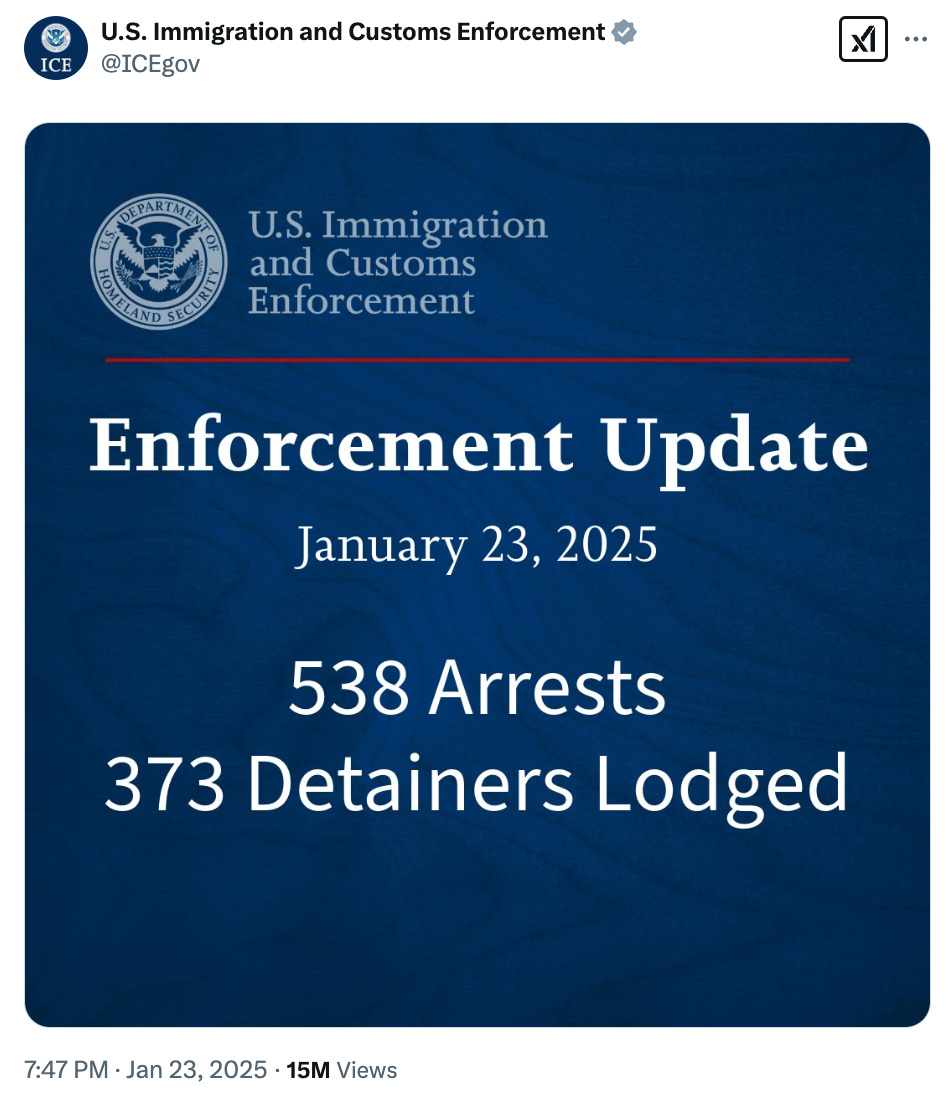
On Thursday January 23, less than four days after Donald Trump was sworn in as president, Immigration and Customs Enforcement’s social media account on X/Twitter began posting daily totals of arrests and detainers. The numbers were intended to reflect—and some would say sensationalize—ICE’s surge in immigration enforcement activity.

But ICE’s posts was as confusing as it was illuminating. What did the numbers mean? Where was ICE getting these numbers and were they accurate? What are arrests and detainers, and are those the best indicators of immigration enforcement activity? What are the numbers hiding?
I spoke with a dozen or so reporters this week about ICE’s data to help them (and the public) find answers to these questions. Not all of those conversations made it into print (which is okay), but the conversations did help me crystalize my concerns about ICE’s public data in a way that I hope will now benefit you.
In this post, I’ll help you read ICE’s new publicly posted enforcement data and point out little things you might have missed along the way. More than just understanding these specific numbers, this post will give you a stronger foundation for how to make sense of immigration data more broadly. I will also show you why I think I might have convinced ICE to improve their data reporting practices.
Help me continue to hold the Trump administration accountable when it produces false or misleading data. This newsletter is only possible because of your support. If you believe in keeping this work un-paywalled and freely open to the public, consider becoming a paid subscriber. You can read more about the mission and focus of this newsletter and learn why, after three years, I finally decided to offer a paid option.
An Introduction to Data Skepticism
Before we examine ICE’s enforcement data, let’s lay the foundation for why and how to think critically about data. After all, we are inundated with statistics these days, whether from politicians trying to convince us of their pet policies, companies trying to market products to us, or friends and family around the table trying to persuade us to support their position.
There’s a reason the world throws so much data at us: data is powerful. Data can help us make better decisions, challenge our misconceptions, and shape how we think about reality. If a company tells us a drug really is 90 percent effective, we could be convinced to take it. If a politician tells us that we are at high risk of victimization, we might support funding for more police.
This is not necessarily a bad thing. We should used data to our advantage when making decisions about our health care or about public policy. But here’s the problem. Data is at its most powerful (and most dangerous) when data is used to make a one-sided argument appear as if it were the only possible truth.
As I want to demonstrate, data is not as disinterested and objective as it might seem. But understanding how to spot the biases or partiality of data requires some basic skills and experience that any of us can develop. At the same time, I also caution against the cliché that you can use data to say “anything”. I think this is a cop-out to doing the important work of thinking through data from a critical perspective.
Often times the most interesting lessons come not from asking if data is “true”, but asking how data might reflect both a certain truth and a certain untruth at the same time—and why. To answer these questions, we often need to understand the incentive structures that guide why some data points get included (and not others) and how they are represented.
In Calling Bullshit: The Art of Skepticism in a Data-Driven World, authors Bergstrom and West advocate for a more critical view of data. Data purport to represent hard reality, but “hard numbers are a lot softer than one might think.” They go on to say, more forcefully, that “numbers are an ideal vehicle for promulgating bullshit.”
From Bergstrom and West’s perspective, “bullshit” doesn’t always mean that someone is flat-out lying to you (although it certainly includes it). Calling bullshit most often means identifying and critiquing the problems with how data are narrated or represented. Sometimes “bullshit” is produced by bad actors. Often times, it is simply the result of lazy, biased, or unskilled actors who hide their subjective assumptions behind the appearance of objective data points and graphs.
It is a good time to recall Campbell’s Law:
“The more any quantitative social indicator is used for social decision-making, the more subject it will be to corruption pressures and the more apt it will be to distort and corrupt the social processes it is intended to monitor.”
In short, what they (and I) advocate for is better data literacy, which means recognizing suspicious, incomplete, and fallacious data so that we are less easily duped and confused by bullshit data. To do that, each of us needs to build and refine our Bullshit Data Detectors (or BDD, for short).
This is especially true when it comes to the polarizing and controversial world of immigration policy. So let’s have a closer look at that social media post from ICE.
Understanding ICE’s Enforcement Data Posts
When I first showed you the image above, I showed only the image itself. I did that on purpose to illustrate what you miss when you only look at data itself and not the metadata. Metadata is data about the data: when it was produced, where it comes from, when it was shared publicly, and so on. Looking at metadata can disenchant the power of almighty data much like Toto pulling back the curtain to reveal that the Wizard of Oz was nothing more than a man at a console.
Let’s start by talking about the main data points: arrests and detainers.
Arrests. ICE has the authority to take noncitizens into custody for violations of civil immigration law, certain criminal violations, as well as the authority to execute certain criminal warrants. Although we most associate arrests with cops catching criminals, ICE arrests are not always (or even primarily) criminal; they are often civil.
Detainers. Detainers are requests that ICE sends to state and local law enforcement agencies to request that the agency either (a) inform ICE when the person is going to be released so that ICE can take that person into custody or (b) hold that person in local custody for ICE to come and take them into custody before they are released.
Taken together, these two data points do legitimately serve as indicators of enforcement activity. If ICE is doing more enforcement, it’s logical that arrests and detainers will increase.
However, my very first question was: is this data accurate? The reason for my concerns came from the metadata and my (albeit imperfect) knowledge of ICE’s data systems.
ICE’s tweet was posted near the end of the workday for the continental United States at 8:00 pm Eastern Time (5:00 pm Pacific Time) on the same day that the data appear to reflect. In short, it appears that ICE is saying “Today, January 23, 2025, we arrested 538 people and sent 373 detainers.”
As anyone who has sent a Freedom of Information Act (FOIA) request to ICE for data knows, ICE is neither fast nor reliable when producing data that the public requests. In court, the agency has complained about requests for data being burdensome because their main data warehouse is huge, messy, and subject to constant changes. It is hardly unusual to receive files from ICE that are inaccurate or incomplete. Even the agency’s own public data is often slow to update (as I wrote about here) or, as in the fall of 2022, was profoundly inaccurate (as I also wrote about here).
Thus, the idea that ICE was suddenly able to enter all of their data into the system by the end of a work day, extract the data from their data systems, validate it, turn it into a social media image, and publish it online seemed wholly suspicious. And, indeed, ICE has never tried (as far as I am aware) to publish updated data of any kind on a daily basis. The agency can barely get their biweekly detention data out on time and correct—and that report is required by Congress.
Moreover, a lot of immigration data takes time to “settle”. What I mean is, due to delays in data entry, it typically takes time (days, weeks, months, even years) for the data systems to catch up with reality. When looking at the number of new immigration cases filed in court, for instance, the number of new cases that started in, say, January 2022 will be higher in March 2022 than in February 2022, because it takes time to enter new cases into the system. (This issue has been improved with electronic filing.)
I’m not saying it’s impossible for ICE to produce these data, I’m just explaining where my concerns come from. Ironically, if these data are accurate, it will likely be because the Biden administration invested heavily in modernizing ICE’s various stovepiped data systems and building out the Office of Homeland Security Statistics (OHSS), which is an excellent research wing within DHS (but separate from ICE).
I raised these concerns on X/Twitter in response to ICE’s posting, leading to questions from reporters about whether these data could be trusted. Some reporters speculated whether the data was not, in fact, extracted from ICE’s own data systems but reported into ICE HQ in DC from the regional field offices. But there are a lot of field offices and that felt like an even more unreliable game of telephone.

Given what we know about ICE’s data management practices and the metadata on their post, I eventually concluded that the most likely scenario was that each day’s data represented the results of enforcement activity for the day before, not for the date listed on the post.
This might seem minor, but it’s a sloppy mistake that reflects my most fundamental concern. I wasn’t so much worried that the agency was lying about the numbers. Rather, I was concerned that the political incentive structure would compel the agency to rush to release data without taking the time to be accurate and reliable. (It wouldn’t be the first time.)
But wait, there’s more!
ICE Responds by Updating Metadata
On January 27, just a few days after I voiced my concerns, ICE updated the information on their posts. They now included the phrase (i.e., metadata) that the data was current through midnight. They changed nothing else on the post.
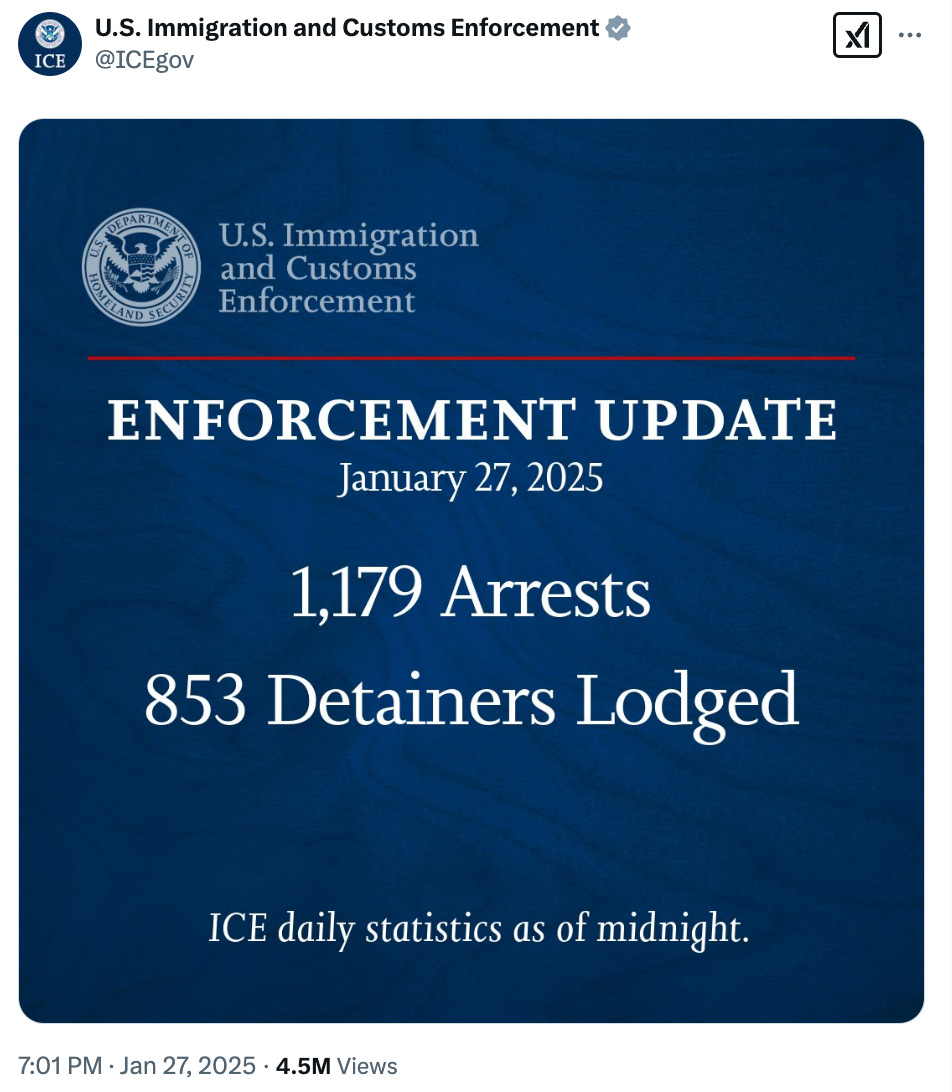
This was a manifestly stupid addition.
The phrase “as of midnight” contained no specifier—and it was on a post that was published again around 7:00 PM. As I suspected, the data was likely being extracted from their systems as the data was recorded at midnight the night before. If you have the chance to read the footnotes in ICE’s public data reports, you’ll see that this is the way they commonly do it.
I was already starting to tally these data in a spreadsheet to track it over time, and I was making a distinction between when they posted the information (e.g., January 27) and the date that the data actually represented (e.g., January 26). However, this post is not clear for the general public and requires some additional data literacy that I felt should not be required to make sense of these data.
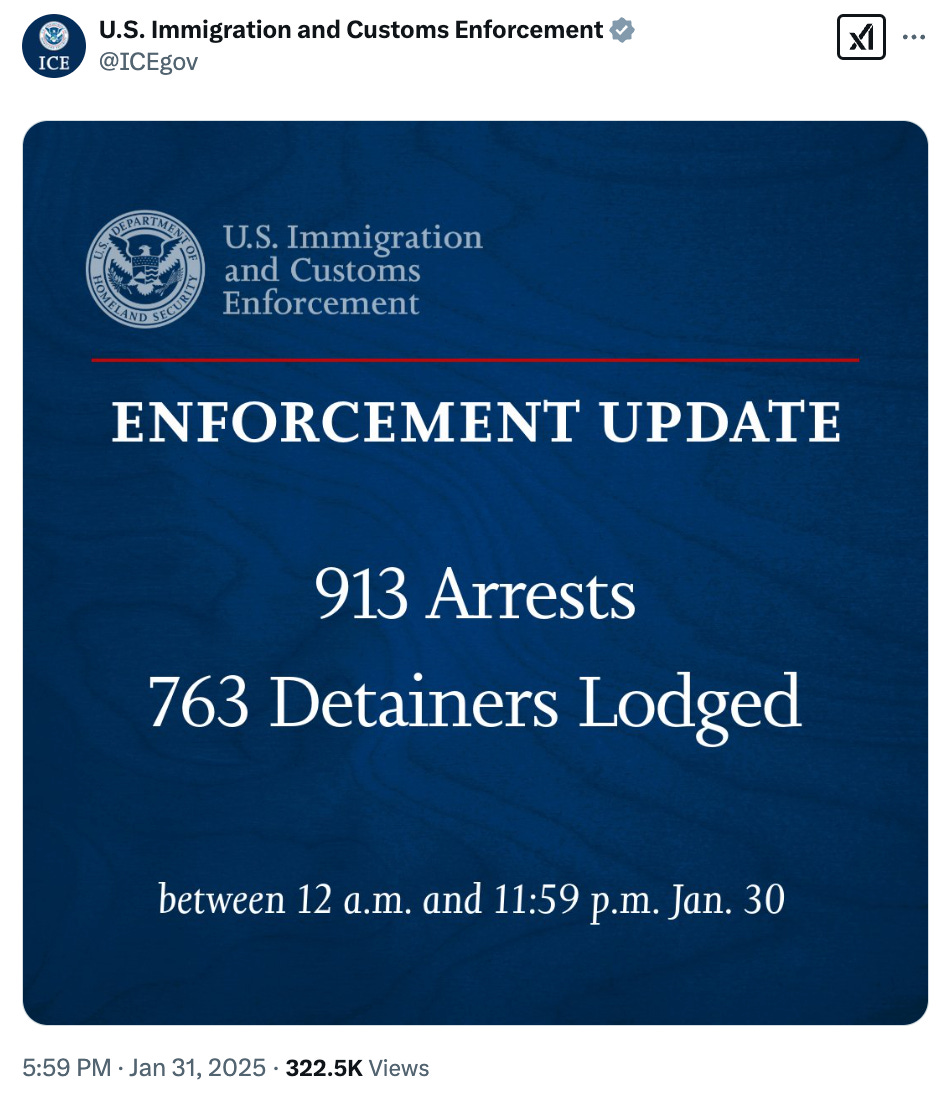
The agency then stopped posting data for two days, and returned on January 31 with yet another revision to their posts. Now they include a more precise phrase (again, this is metadata) that specifies that the data in question, which was posted on January 31, actually reflects ICE activity on January 30 (as I suspected).
Whew! I’m glad we got that clarified. (And maybe my rounds of public complaints had something to do with it.)
Why didn’t they just do that the first time? Probably a combination of sloppiness and manufactured urgency. These agencies do not have unlimited staff and the staff they do have may not be too enthusiastic about quality control right now.
Whatever the reason, this minor but essential point has finally been clarified. But you can see how agencies themselves can contribute to confusion and misinformation. And you can see how something as simple as two data points is actually a lot messier and squishier than it first appears if you’re just doomscrolling on your phone.
I want to be clear: I support the agency releasing more data, since this is a key part of government transparency. But false or misleading data is no transparency at all, so I just want to make sure that the data they are releasing is legitimate and not confusing or inaccurate as a result of a quest for political spectacle.
Data Questions Continue
Are we all done here? No!
For one, now that ICE has (allegedly) shown that it can pull data this quickly, there’s no reason why the agency shouldn’t release the underlying case-by-case records to the public on a more timely and proactive schedule. I’ve said many times now that if the Trump administration is serious about rooting out the “deep state” and showing the public that he’s serious about deporting criminals, the agency should release these records to the public.
If the agency has records that its officers arrested 913 people, then the agency also has records that show the nationality, location, criminal histories, and much more about these arrests. The agency could prove that they are going after criminals, which they are constantly claiming on their same social media account. I know they could: I’ve seen the data. Until I see the underlying data, I will consider these data to be unverified.
However, they are unlikely to show us those data for the simple reason that the increase in arrests and detainers are very likely driven mostly (although not exclusively) by increase in arrests and detainers for people with little or no criminal record. (I’ll explain why in great detail in my next post.)
I am also curious to see if the agency will continue to publish these data online and if the numbers continue to increase. While I still have some skepticism about treating these data as authoritative, here’s a graph of the data produced so far.

Stay Skeptical Out There
You may not think that what ICE posts on social media should matter that much or is with this much analysis. But these posts are getting millions of views and they are already being treated as if they represent the truth—even though the agency’s representation of these data were flawed from the beginning. Besides, for those if you interested in developing your “BDD” (Bullshit Data Detector), this was a simple exercise in how to practice critical data literacy skills on what was an otherwise deceptively simple social media post.
With the Trump administration gutting many parts of government that are essential for data analysis and agency oversight, problems with data are likely to only get worse—and get bigger and more worrisome. During the first Trump administration, the research lab formerly known as the Transactional Records Access Clearinghouse (TRAC) found significant errors in the data on asylum seekers. When we reached out to the Department of Justice to inform them of these problem, the agency completely ignored our concerns and our evidence of the problem. I expect we’ll see even more of that dismissive approach to truth this time around, possibly with even bigger consequences.
For all these reasons, stay skeptical out there. Data is an important tool for understanding the world, but it is not perfect and it is not objective. As my colleague Rob Kitchen shows in his book Data Lives, data is produced, not just collected—and we can use this knowledge to be smarter about how we make sense of immigration data over the next four years.
Consider Supporting Public Scholarship
Thank you for reading. Please subscribe to receive this newsletter in your inbox and share it online or with friends and colleagues. If you believe in this work, consider supporting it through a paid subscription. Learn more about the mission and the person behind this newsletter.


As you point out at the beginning of your piece, data are collected and then reported to make an argument ("The numbers were intended to reflect—and some would say sensationalize—ICE’s surge in immigration enforcement activity."). Often the people collecting the data and those reporting them are different and may be making different arguments with them. Yes, the first thing to do in testing whether the data support the argument being made is to ensure they are correct and are sufficiently transparent so they can be fully understood. Then are they relevant and sufficient to making the argument persuasive. I suspect for some who want to believe that ICE under Trump is cracking down on undocumented individuals all they need to see are high numbers and the surge argument is persuasive. But, as you point out with the graph at the end, high numbers for one day hardly prove a surge. A graph showing similar numbers well before the change in administration and for a good period afterward is required. Further, how is the argument being interpreted? "See, we're getting rid of more criminals!" But, again, as you point out, more data are required to make the leap from "surge" to "criminal deportations." I do not envy your task, Austin, in trying to work so closely with data, as you must, and then carefully and sensitively communicating what they mean and how they relate to the arguments being made with them!
Well done, thank you for this. Semi-related, it made me think of a book by a Syracuse author, Mark Monmonier, "How to Lie with Maps." I read it when it first came out in 1991, but apparently it's been updated twice, most recently in 2018, to keep up with digital info. I wouldn't put it past Greg Abbott and his ilk to lie with maps, along with everything else.